Dependencies
- Python 3.6+
- numpy
- matplotlib
- ffmpeg framework (for saving animations as movie files)
Installation
Python 3.6+, numpy and matplotlib are required for this module to produce the animations and ffmpeg to save them. Assuming you have at least python 3, numpy and matplotlib installed, clone/download this repository then run the setup file with python setup.py install from the command. This allows taco_vis to be imported from within the python environment, otherwise taco_vis.py must always be present in your working directory.
Tests may be conducted by running the included tests.py script. Output files should match those in the test_files/ directory.
ffmpeg can be obtained with instructions from https://ffmpeg.org
Usage
Data must be angular velocity values in either a 2D or 3D numpy array. The dimensions of the array correspond to the number of points in radius/time (for 2D) or radius/azimuth/time (3D) repsectively. The data is also assumed to be on a regular grid with radius in the domain [0,1] and azimuth between [0, 2pi].
Animations and figures are generated with the ‘FLOW’ class, which is initialised with the data array:
There are 3 types of plot available with the following methods: plot_contours, plot_cylinders and plot_cylinders_3D (detailed in full below). Animations or still images may be plotted and/or saved to disk for each of the style of plots provided. The same 3 keyword arguments are available for each:
- animate (default = False). If True then a matplotlib animation is created, iterating through the time axis of the data. If False then simply a static plot of one time interval of the data will be created.
- save (default = False). If True then the image (if animate is False) or animation (if animate is True) will not be shown but instead saved to the current working directory.
- time_idx (default = 0). If animate is False then this specifies the time index along the 3rd dimension of the data to be staically plotted.
cylinders
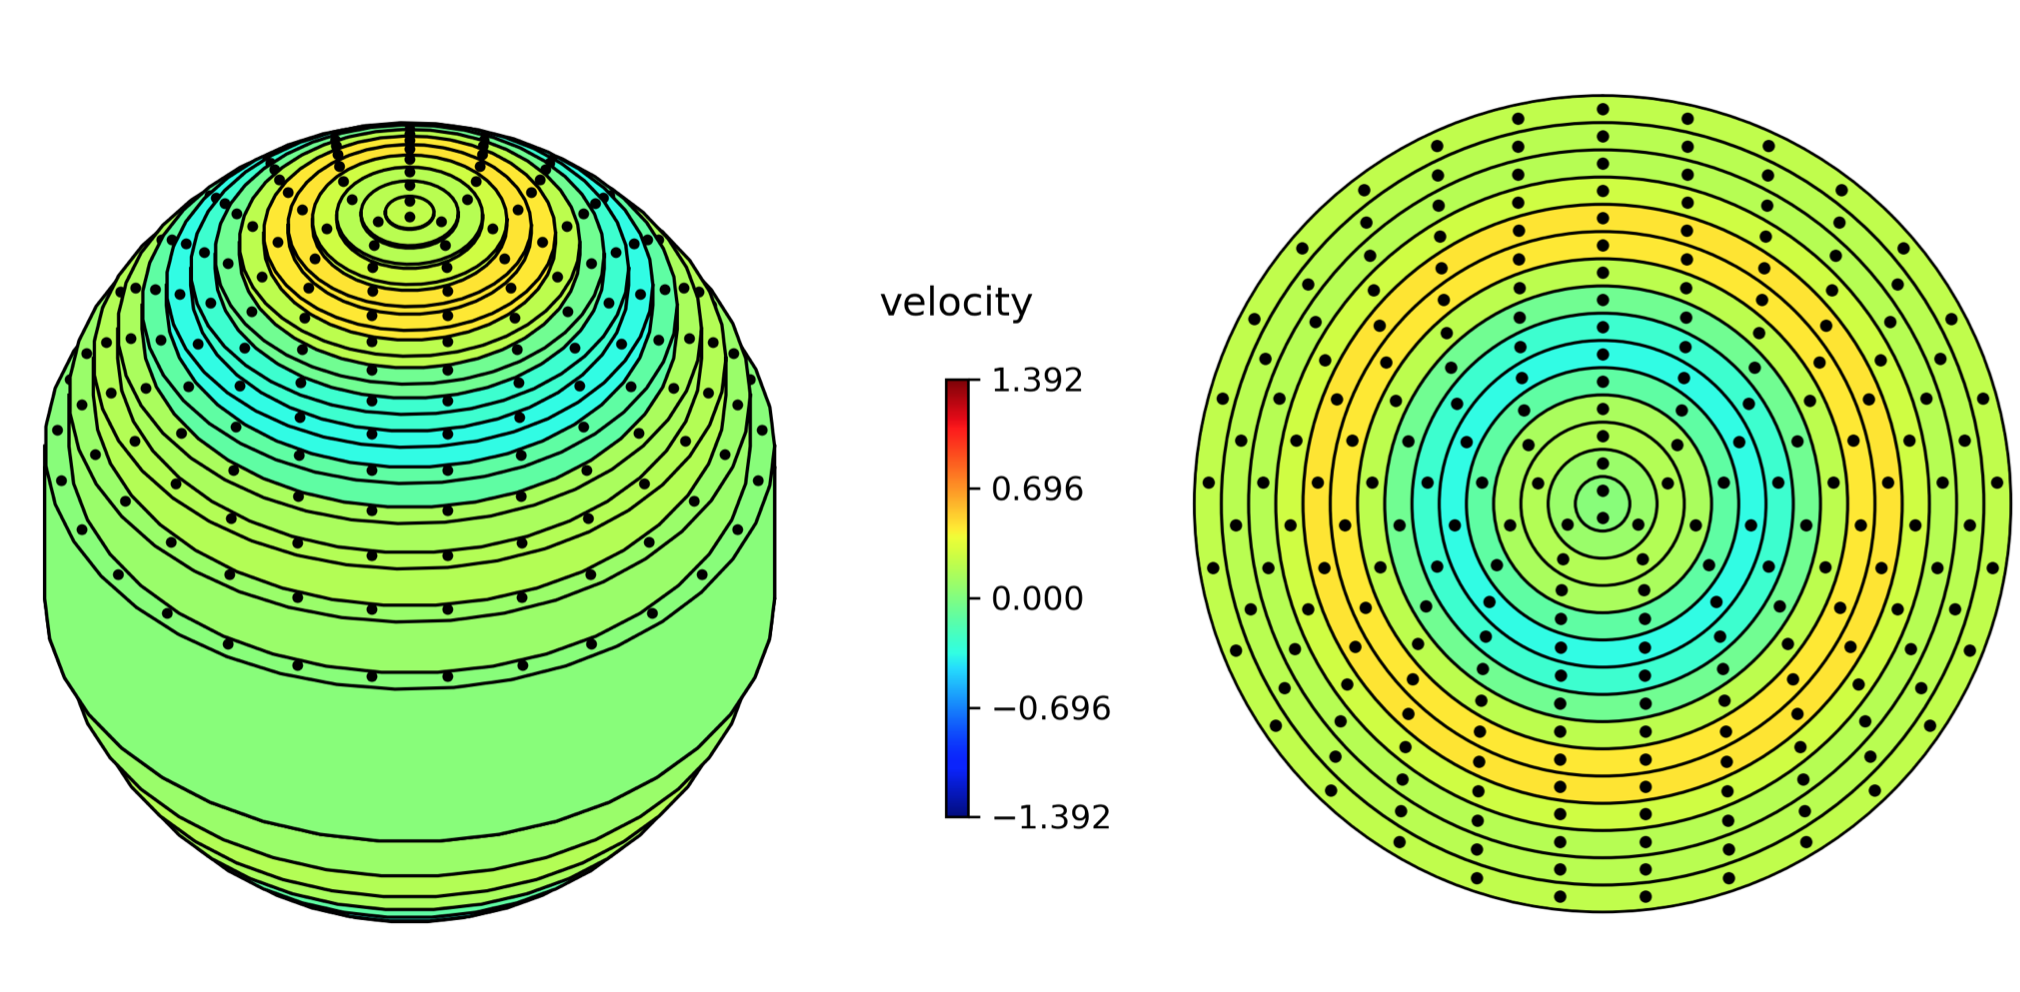
This produces a 2D plot of a slice through the equitorial plane with concentric circles representing the concentric cylinders (with as many cylinders as there are radial grid points in the data). A series of black dots are plotted on each cylinder and are advected to visualise the sense of rotation. The cylinders are coloured by the value of velocity at that time interval (right of figure below).
cylinders_3D
The same as ‘cylinders’ but instead the plot is a 3D representation of the cylinders within a spherical core (left of figure below).
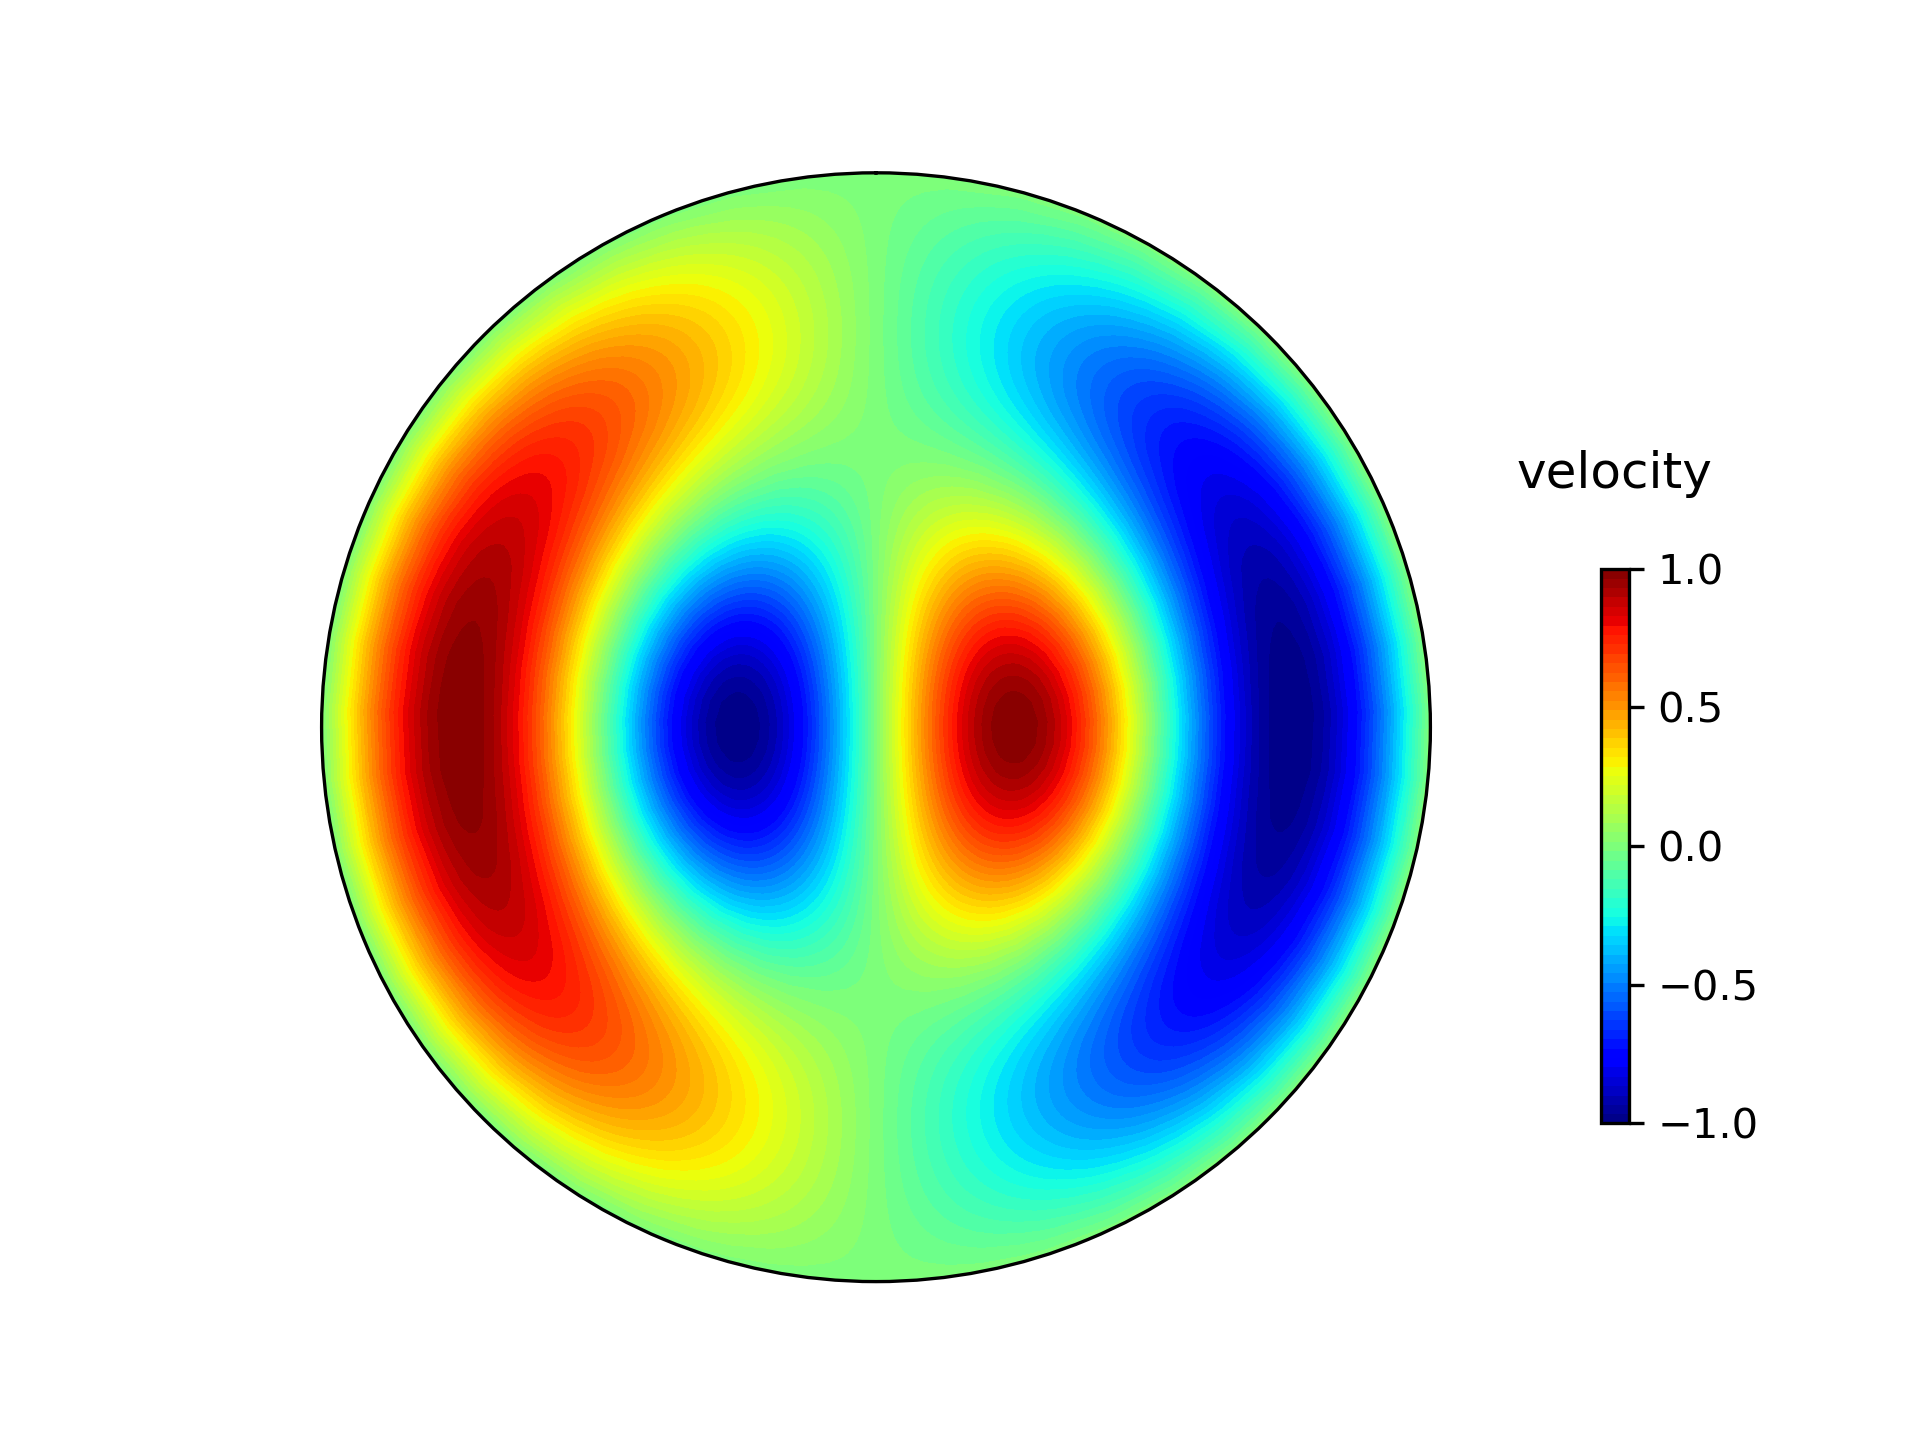
contours
A filled contour plot of the data is produces, which does not strictly need to be axisymmetric and hence the data array may be 3D (radius, theta, time).
Default settings for the appearance of the plots are attributes of the FLOW class. Current settings can be seen by the call method of the class:
Speed: (float) Factor applied to the movement of the texture of the cylinders and cylinders_3D animations. A reasonable value is such that FLOW.speed x velocity is approximately 1.
colorbar_title: (string) The title for the colorbar.
title: (string, with formatting) Title for the figure. Internally the title is set with plt.title(FLOW.title % FLOW.time[i]), where FLOW.time[i] is the current iterations value for time that is passed into the string with formatting. By default FLOW.time is assumed to be an array ranging from 1 through to the size of the last dimension of the data (i.e. number of points in time) but can be set to another array if the user wishes.
movie_filename: (string) filename that movie files will be saved to. Type of movie file (e.g. mp4, avi etc.) is specified by the extension.
image_filename: (string) filename that image files will be saved to. Type of image file (e.g. png, jpeg etc.) is specified by the extension.
dpi: (int) resolution of the save images.
fps: (int) frames per second movie files are saved with.
c_scale: (float) The range of the colorbar which runs from -c_scale through to +c_sale. By default the maximum amplitude within the dataset
API Reference
-
class
taco_vis.FLOW(data)¶ Main class whose methods may be used to produce plots. Settings applied to the plots are stored as attributes to any instance of this class which can be changed by the user. Use the __call__() method to see what settings are available and their current value.
-
__call__()¶ Print to screen the current settings of the FLOW class
-
__init__(data)¶ Parameters: data (3D or 2D numpy array) – Values representing angular velocity. The shape of the array should represent the number of data points in radius, theta and time respectively (for 3D) or just radius and time (for 2D axisymmetric flows).
e.g. if shape(data) = (5,10,20), then there are assumed 5 points in radius, 10 in theta and 20 in time (for a 3D array) or if shape(data) = (5,10) then there are assumed 5 points in radius and 20 in time (for a 2D array).
For contour plotting 2D datasets, by default 50 points in theta are created. This can be changed by setting the FLOW.th_resolution attribute to some other number after the class has been initialised if the user wishes.
Default settings (self.__call__() method prints settings to screen): self.speed = 1
self.colorbar_title = “velocity” self.title = “time: %3.1f years”
self.movie_filename = “output.mp4” self.image_filename = “output.png” self.dpi = 200 self.fps = 24
self.c_scale = maximum magnitude within the data
-
plot_contours(animate=False, save=False, time_idx=0)¶ Method for plotting flow as in an equitorial plane view with filled contours.
Parameters: - 'animate' (bool.) – If True will animate the plot
- 'save' (bool.) – If True the plot will be saved rather than plotted
- 'time_idx' (int.) – If animate is False, a still image will be plotted at this time index.
-
plot_cylinders(animate=False, save=False, time_idx=0)¶ Method for plotting flow as 2D concentric cylinders in an equitorial plane view.
Parameters: - 'animate' (bool.) – If True will animate the plot
- 'save' (bool.) – If True the plot will be saved rather than plotted
- 'time_idx' (int.) – If animate is False, a still image will be plotted at this time index.
-
plot_cylinders_3D(animate=False, save=False, time_idx=0)¶ Method for plotting flow as 3D concentric cylinders in an 3D view
Parameters: - 'animate' (bool.) – If True will animate the plot
- 'save' (bool.) – If True the plot will be saved rather than plotted
- 'time_idx' (int.) – If animate is False, a still image will be plotted at this time index.
-
Bug reporting and contributions
If you find a bug, please raise it within the issues on this repository and I’ll work with you to fix it. I’m currently not taking external contributions to the code but will endevour to communicate and solve any bugs that are found.
Known issues
You may run into problems with matplotlib interfacing with ffmpeg to save animations.
If you get an error something along the lines of: ValueError: Invalid file object: <_io.BufferedReader name=X> where X is some number, your binary of ffmpeg may not be working. This can be common if you are using an environment manager, such as anaconda, that matplotlib is being pointed towards and may be solved by installing the ffmpeg binary to your system yourself and having at the beginning of your python script:
using the file path to the ffmpeg binary (which may be different to the one above) to force it to use that one, rather than the ffmpeg inside the anaconda path.